Fleet Analytics for Trucking Carriers: The Data That Now Prices Your Insurance
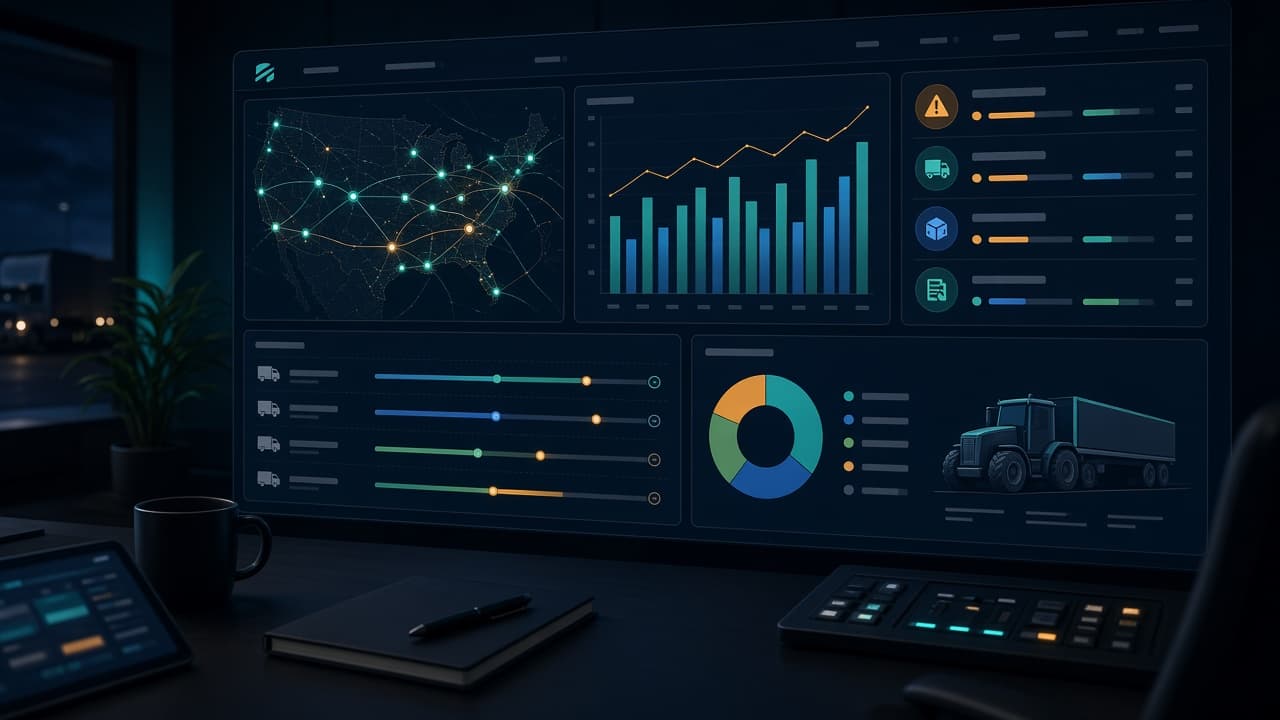
For years, trucking insurance was priced primarily on loss runs, years in operation, commodities hauled, and radius. That model is shifting. Underwriters increasingly treat carrier-side analytics—telematics utilization, driver scorecards, coaching documentation, and operational metrics—as a parallel input to traditional loss history. The carriers who can present this data coherently are earning better capacity and rates than those who cannot, even when their loss records are similar.
The same data also matters for shipper qualification. Large shippers and brokers now audit carrier safety programs before onboarding, asking for the same scorecard exports, coaching records, and CSA management practices that insurers request. Carriers that build an analytics foundation for insurance positioning simultaneously improve their marketability to shippers.
Analytics as a carrier credit score
Think of fleet analytics as the credit score for your trucking operation. A consumer credit score aggregates payment history, utilization, account age, and inquiries into a single number lenders use to price risk. Fleet analytics performs a similar function: aggregating telematics events, maintenance discipline, safety documentation, and cost data into a profile that insurers and shippers use to evaluate your operation.
Unlike a credit score, no single bureau produces this number. Each carrier must assemble their own profile from the systems they run. That is both a burden and an opportunity. Carriers who invest in data governance can shape how their risk profile is perceived. Carriers who do not leave the interpretation to others—underwriters who see only loss runs, shippers who see only CSA scores.
The data sources that matter
A complete fleet analytics picture draws from multiple operational systems. Each source contributes a piece of the risk and performance profile:
| Source | What It Contributes | Insurance/Shipper Relevance |
|---|---|---|
| TMS | Revenue, lanes, customers, on-time performance, accessorials | Demonstrates operational consistency, customer concentration, service quality |
| Telematics / ELD | Miles, hours, location, driving events (hard braking, speeding, following distance) | Directly feeds driver scorecards and risk profiling |
| Camera systems | Video of critical events, exoneration evidence, coaching material | Reduces litigation exposure, supports documented coaching |
| Maintenance / CMMS | Work orders, PM intervals, downtime, repair costs | Indicates asset discipline, reduces mechanical failure risk |
| Fuel cards / IFTA | Fuel consumption, MPG by unit, fuel cost allocation | Completes cost-per-mile picture, identifies variance |
| Safety / HR | Training records, coaching documentation, MVR pulls, drug testing | Proves driver qualification and safety-program maturity |
| Claims history | At-fault vs. not-at-fault, claim severity, litigation outcomes | Traditional underwriting input, now contextualized by other data |
Each of these systems produces data. The analytics challenge is bringing them together under common definitions—cost per mile that finance and operations agree on, driver scorecards that coaching and insurance use the same way, maintenance intervals that dispatch respects.
Scorecards: the metric insurers request
Driver scorecards have moved from an internal management tool to an external underwriting input. Insurers increasingly ask for scorecard exports or summary statistics: average score by driver, fleet-wide event frequency, and trend over the past year. The scorecard synthesizes telematics events into a comparable metric.
A useful scorecard weights events by severity and frequency. A hard-braking event on an icy day differs from a hard-braking pattern on dry roads. Distracted-driving alerts from a reliable AI model differ from false positives from a poorly calibrated system. Carriers should understand how their telematics vendor calculates scores and whether those calculations align with how insurers evaluate risk.
- Export scorecards monthly and retain history for at least 12 months.
- Track fleet-wide averages and worst-quartile drivers separately.
- Tie scorecard thresholds to coaching triggers (e.g., any driver below 70 requires a documented conversation).
- Present trend data during renewal, not just a snapshot.
Coaching records as underwriting documentation
A scorecard shows risk. A coaching record shows response. Insurers and attorneys both care whether the carrier acted on the data. A driver with declining scores and no documented intervention is a liability. A driver with the same scores and a file of coaching conversations, improvement plans, and acknowledgments tells a different story.
Coaching documentation should link directly to the triggering event. When an underwriter asks about a hard-braking incident, the carrier should be able to produce the telematics record, the coaching summary, and the driver's acknowledgment. The connection cannot live in someone's memory or an email thread.
The companion post on telematics as the insurance baseline covers this in detail. The point here is that coaching records are not just an HR artifact. They are an analytics output with underwriting value.
Cost-per-mile: the governed metric
Cost-per-mile (CPM) is the operational metric most carriers argue about. Finance uses one definition, dispatch uses another, and leadership sees a third number in the Monday report. Until CPM is governed—a single formula, applied consistently, with documented inputs—the fleet cannot make reliable decisions about lanes, customers, or equipment.
A governed CPM also supports insurance and shipper conversations. A carrier that can demonstrate consistent profitability, managed fuel cost, and controlled maintenance spend presents a more stable risk than one with volatile or undefined margins. Shippers evaluating capacity partners care about carrier financial health; a governed CPM demonstrates operational discipline even if the number itself is not shared externally.
FleetOS is built around this problem. It ingests TMS, telematics, maintenance, and fuel data and produces a CPM view that operations and finance use the same way. The internal benefit is ending the Monday argument. The external benefit is a carrier that can speak coherently about its cost structure.
Exception-first operations
Analytics is not about more dashboards. It is about surfacing the exceptions that require attention while letting the loads on plan stay on plan. An exception-first operating cadence reduces the noise and focuses management time on the decisions that matter.
- Loads off plan: pickups at risk, deliveries behind schedule, documents missing.
- Drivers with declining scores or events exceeding threshold.
- Units dispatched with open downing work orders.
- Customers or lanes trending below contribution threshold.
- Fuel transactions unmatched to a load or unit.
This operating model also produces better data. When exceptions are reviewed and resolved daily, the records are fresher and more accurate. When coaching happens within 24 hours of an event, the documentation is credible. The analytics foundation improves because the operational process around it improves.
Shipper qualification and onboarding
Large shippers and 3PLs increasingly audit carrier safety and operational programs before awarding freight. The audit requests often overlap with insurance renewal packages: equipment lists, telematics utilization, coaching processes, CSA management, training records. A carrier with an analytics foundation built for insurance can repurpose the same exports for shipper qualification.
The reverse is also true. A carrier that cannot produce consistent data for a shipper audit will struggle to produce it for an insurance renewal. Building the analytics layer once serves both audiences.
CSA and FMCSA data management
Compliance, Safety, Accountability (CSA) scores remain an input to both insurance underwriting and shipper decisions. High percentiles in any BASIC trigger scrutiny. Carriers should monitor CSA data proactively, challenge incorrect inspection results, and manage the behaviors that drive violations.
CSA management connects to telematics. Hours-of-service violations appear in both the ELD and the CSA record. Speeding events captured by telematics may also appear as inspection findings. The data should reconcile: if the telematics shows a pattern, the carrier should address it before it becomes a roadside event.
Maintenance discipline and risk
Mechanical failures that cause accidents generate severe losses. Insurers care about maintenance discipline: are PMs on schedule, are brake and tire inspections documented, are downtime codes tracked? A carrier with a well-managed CMMS presents lower mechanical-failure risk than one with ad-hoc shop practices.
Maintenance data also feeds operational analytics. Units with high repair cost, frequent downtime, or overdue PMs should surface in the morning exception list, not in a surprise breakdown. When dispatch sees the same maintenance status the shop sees, the fleet avoids dispatching unavailable equipment.
Building the analytics foundation
Carriers do not need to replace their TMS, telematics, or maintenance systems. They need a governed layer on top that consolidates the data, applies consistent definitions, and produces the outputs insurers and shippers request. That layer is what FleetOS provides: ingest, validate, warehouse, and publish.
The build sequence matters. Start with the data that already exists in operational systems. Validate it before trusting it—duplicate loads, missing timestamps, and mismatched units pollute downstream analytics. Define the metrics (CPM, scorecard thresholds, exception triggers) and document the formulas. Then surface the outputs: morning briefs, exception queues, export packages.
The operational problems carriers face—fragmented data, undefined metrics, manual reconciliation—are covered in the problems every fleet faces. Solving those problems for operations also solves them for insurance and shipper analytics.
The renewal package revisited
A carrier with a mature analytics foundation can prepare a renewal package that goes beyond loss runs and ACORD forms:
- Equipment summary with telematics and camera coverage percentages.
- Driver scorecard summary: fleet average, worst quartile, and trend over the past year.
- Coaching documentation sample: how events are reviewed, documented, and acknowledged.
- Safety-program overview: written policies, training cadence, CSA management process.
- Operational metrics: on-time performance, utilization, cost-per-mile trend (if sharing externally).
- Maintenance summary: PM compliance rate, average downtime, brake/tire inspection frequency.
This package positions the carrier as a data-mature operation. Underwriters who see only loss runs and ACORD forms cannot differentiate the carrier from competitors. Underwriters who see a complete analytics package can price the risk more precisely—and often more favorably.
How Vyntrix Labs helps
FleetOS is the fleet intelligence operating system we build for motor carriers. It connects TMS, telematics, maintenance, and fuel into a governed data layer with consistent CPM, exception-first queues, driver scorecards, and export packages for insurance and shipper qualification. The goal is a single operating picture that operations, finance, safety, and leadership can trust.
For carriers also selling or administering insurance capacity, HaulSure OS provides the workflow, documentation, and reporting layer for trucking insurance operations. The two products complement each other: FleetOS governs the carrier's operational data, HaulSure governs the insurance documentation and risk presentation.
Conclusion
Fleet analytics has moved from a back-office reporting function to a front-line commercial asset. The data that powers daily operations—telematics events, maintenance records, cost-per-mile calculations, coaching documentation—is now the data that prices insurance and qualifies carriers for shipper freight. Carriers that govern this data, define consistent metrics, and produce coherent outputs will outperform those who leave the interpretation to underwriters and auditors reviewing loss runs and CSA scores. The analytics foundation you build for operations is the same foundation you present for insurance and shipper qualification.
Frequently asked questions
What is the minimum analytics stack a carrier needs?
At minimum: a TMS with clean order data, a telematics platform with driver scorecards, documented coaching records linked to events, and a maintenance system with PM tracking. The gap is usually the governed layer that connects them and produces consistent exports.
How do analytics help with insurance beyond lower premiums?
Analytics documentation also supports claims defense. When a plaintiff attorney alleges the carrier ignored warning signs, documented coaching records, scorecard trends, and event-review logs demonstrate due diligence. The same data that earns better rates also reduces litigation exposure.
Should we share cost-per-mile data with underwriters?
CPM itself is rarely requested, but the discipline it represents is valuable. A carrier that can speak coherently about cost structure, margin management, and operational consistency presents a more stable risk. The number may stay internal, but the capability is visible.
How do shipper qualification requests differ from insurance renewals?
Shippers focus more on service quality (on-time performance, communication, claim ratios) while insurers focus on risk (scorecards, coaching, maintenance discipline). The underlying data overlaps significantly. Building exports for one audience often satisfies the other.
What if our data is messy or incomplete?
Start with validation. Identify the gaps—missing timestamps, duplicate records, unmatched transactions—and address them at the source. A governed analytics layer cannot fix upstream data quality; it can only report what is wrong. Clean the inputs before trusting the outputs.
How long does it take to build an analytics foundation?
The timeline depends on data maturity. A carrier with clean TMS and telematics data can stand up governed dashboards and exports in weeks. A carrier with fragmented systems and undefined metrics may need months to align definitions before analytics is useful. Start with one metric (e.g., CPM or driver scorecards) and expand.
Ashir Haroon
CEO at Vyntrix Labs
Keep reading

Telematics Is Now the Baseline for Commercial Trucking Insurance
Insurers no longer reward carriers for simply installing ELDs, cameras, and telematics. They underwrite based on how fleets use the data: documented coaching, safety culture, and risk-score improvement over time. Here is what carriers need to understand about the shift.
Ashir Haroon
CEO
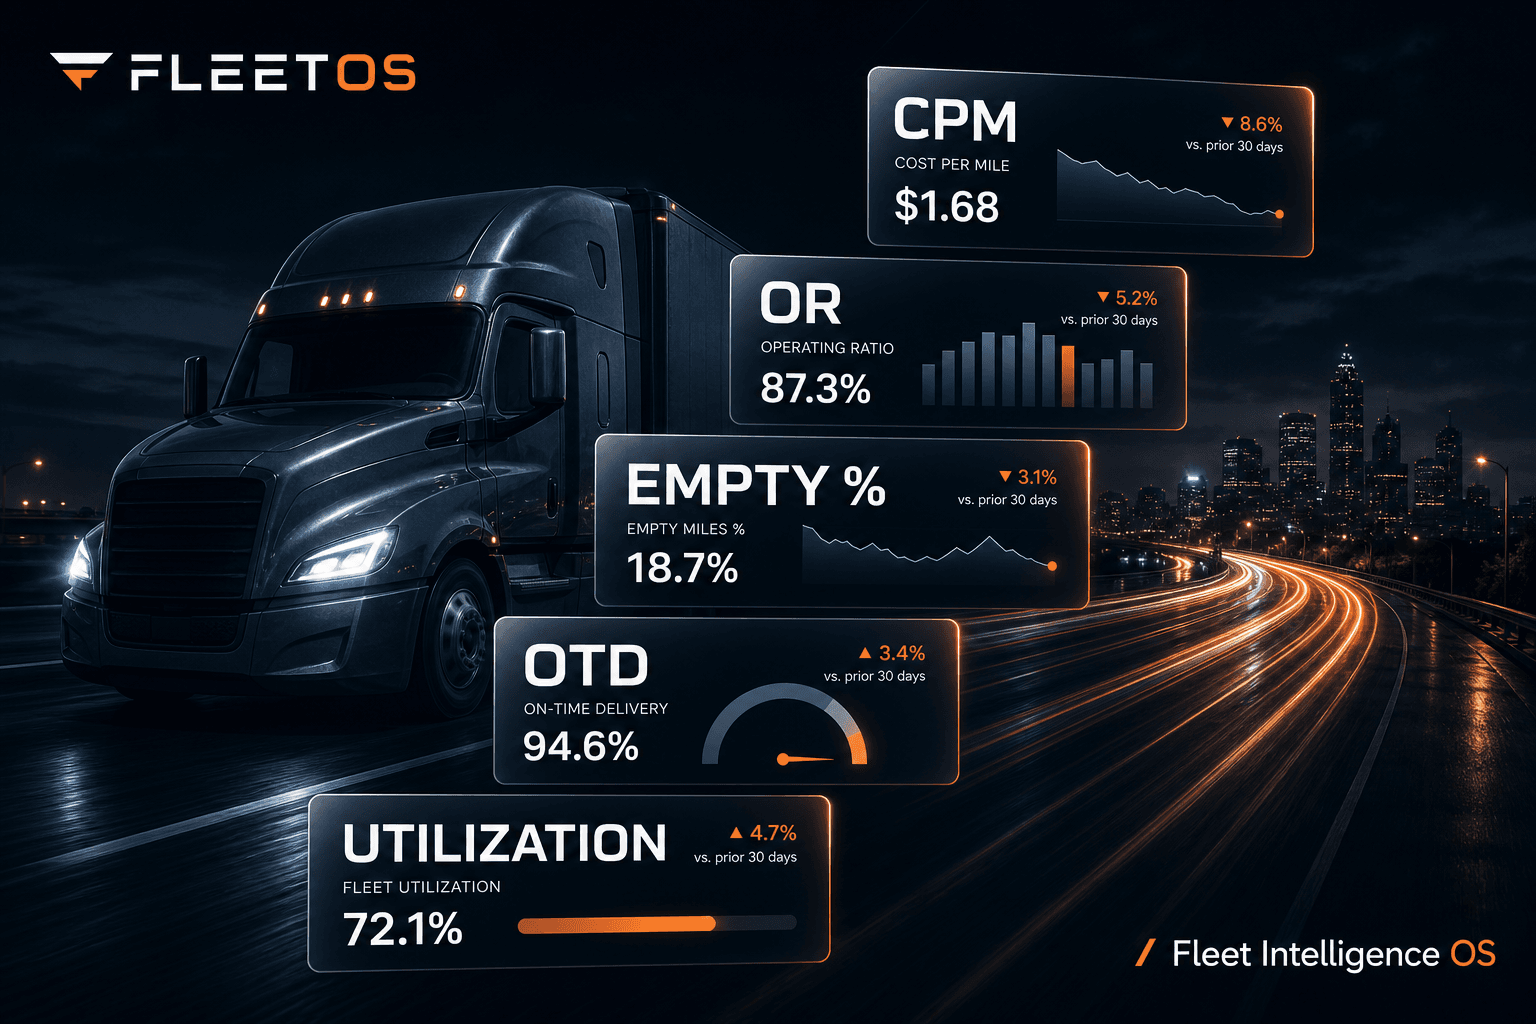
FleetOS: Why Fleet Intelligence Is More Than Dashboards
Motor carriers already own TMS, telematics, and shop systems. FleetOS is the governed decision layer on top, cost-per-mile truth, exception-first ops, and AI that explains what to do next.
Ashir Haroon
CEO
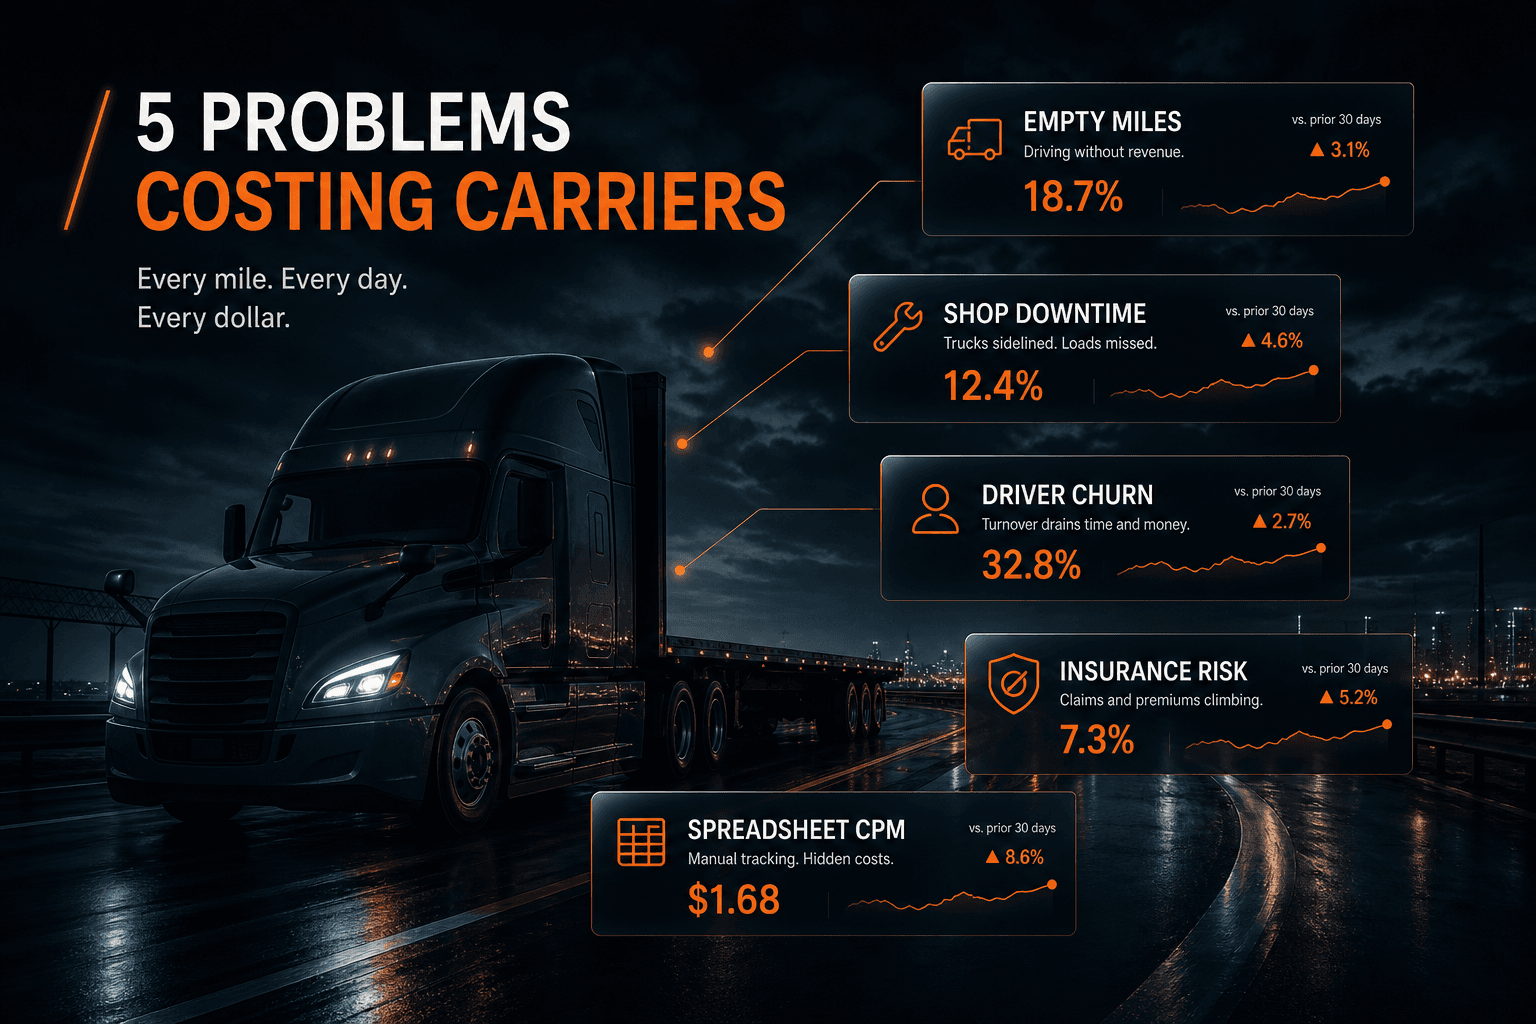
Operational Problems Trucking Carriers Still Have to Manage
Empty miles, detention, maintenance, dispatch, billing, and fragmented TMS and ELD data, why these carrier problems persist, and where a shared operating picture changes the work.
Sufyan
AI Engineer